The Quarterly Report shows total activity on your site for each quarter of a
year. Remember that each page hit can result in several server requests as the
images for each page are loaded.
Note: Most likely, the first and
last quarters will not represent a complete quarter's worth of data, resulting
in lower hits.
| Quarter | Number of requests | Percentage of the requests | |
|---|---|---|---|
| 1. | Q2 2026 | 29,857 | 12.33% |
| 2. | Q1 2026 | 26,960 | 11.13% |
| 3. | Q4 2025 | 28,993 | 11.97% |
| 4. | Q3 2025 | 35,192 | 14.54% |
| 5. | Q2 2025 | 34,578 | 14.28% |
| 6. | Q1 2025 | 31,574 | 13.04% |
| 7. | Q4 2024 | 22,456 | 9.28% |
| 8. | Q3 2024 | 25,715 | 10.62% |
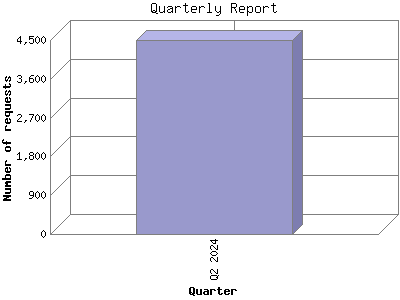
| 9. | Q2 2024 | 6,799 | 2.81% |
Most active quarter Q3 2025 : 35,192 requests handled.
Quarterly average: 26,902 requests handled.
This report was generated on June 19, 2026 01:31.
Report time frame June 3, 2024 00:10 to June 18, 2026 23:53.
| Web statistics report produced by: | |
 Analog 6.0 Analog 6.0 |  Report Magic 2.21 Report Magic 2.21 |