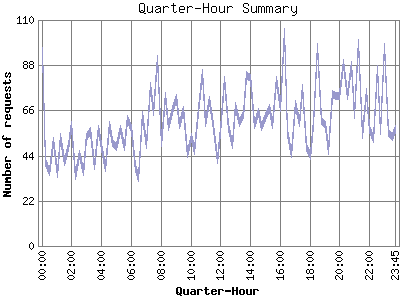
The Quarter-Hour Summary shows an overview of site activity over the course of a day, broken down into fifteen-minute intervals. If your report has enough traffic this will give you a detailed graph of your site's load throughout the day.
| Quarter-Hour | Number of requests | Percentage of the requests | |
|---|---|---|---|
| 1. | 00:00 | 1,971 | 0.84% |
| 2. | 00:15 | 2,220 | 0.95% |
| 3. | 00:30 | 2,226 | 0.95% |
| 4. | 00:45 | 1,892 | 0.81% |
| 5. | 01:00 | 1,824 | 0.78% |
| 6. | 01:15 | 1,899 | 0.81% |
| 7. | 01:30 | 1,871 | 0.80% |
| 8. | 01:45 | 1,663 | 0.71% |
| 9. | 02:00 | 1,757 | 0.75% |
| 10. | 02:15 | 1,877 | 0.80% |
| 11. | 02:30 | 1,684 | 0.72% |
| 12. | 02:45 | 1,831 | 0.78% |
| 13. | 03:00 | 1,776 | 0.76% |
| 14. | 03:15 | 1,662 | 0.71% |
| 15. | 03:30 | 1,806 | 0.77% |
| 16. | 03:45 | 1,857 | 0.79% |
| 17. | 04:00 | 1,594 | 0.68% |
| 18. | 04:15 | 1,981 | 0.85% |
| 19. | 04:30 | 1,958 | 0.84% |
| 20. | 04:45 | 2,245 | 0.96% |
| 21. | 05:00 | 1,925 | 0.82% |
| 22. | 05:15 | 1,900 | 0.81% |
| 23. | 05:30 | 1,601 | 0.69% |
| 24. | 05:45 | 1,799 | 0.77% |
| 25. | 06:00 | 1,789 | 0.77% |
| 26. | 06:15 | 2,114 | 0.90% |
| 27. | 06:30 | 1,996 | 0.85% |
| 28. | 06:45 | 1,862 | 0.80% |
| 29. | 07:00 | 1,969 | 0.84% |
| 30. | 07:15 | 2,205 | 0.94% |
| 31. | 07:30 | 2,149 | 0.92% |
| 32. | 07:45 | 2,493 | 1.07% |
| 33. | 08:00 | 2,555 | 1.09% |
| 34. | 08:15 | 2,129 | 0.91% |
| 35. | 08:30 | 2,391 | 1.02% |
| 36. | 08:45 | 2,298 | 0.98% |
| 37. | 09:00 | 2,549 | 1.09% |
| 38. | 09:15 | 2,447 | 1.05% |
| 39. | 09:30 | 2,521 | 1.08% |
| 40. | 09:45 | 2,522 | 1.08% |
| 41. | 10:00 | 2,873 | 1.23% |
| 42. | 10:15 | 2,612 | 1.12% |
| 43. | 10:30 | 2,791 | 1.19% |
| 44. | 10:45 | 3,020 | 1.29% |
| 45. | 11:00 | 2,444 | 1.05% |
| 46. | 11:15 | 2,926 | 1.25% |
| 47. | 11:30 | 3,190 | 1.36% |
| 48. | 11:45 | 2,796 | 1.20% |
| 49. | 12:00 | 3,060 | 1.31% |
| 50. | 12:15 | 3,269 | 1.40% |
| 51. | 12:30 | 2,926 | 1.25% |
| 52. | 12:45 | 2,817 | 1.21% |
| 53. | 13:00 | 3,121 | 1.33% |
| 54. | 13:15 | 3,151 | 1.35% |
| 55. | 13:30 | 2,891 | 1.24% |
| 56. | 13:45 | 2,820 | 1.21% |
| 57. | 14:00 | 3,000 | 1.28% |
| 58. | 14:15 | 2,899 | 1.24% |
| 59. | 14:30 | 2,527 | 1.08% |
| 60. | 14:45 | 2,629 | 1.12% |
| 61. | 15:00 | 2,522 | 1.08% |
| 62. | 15:15 | 2,809 | 1.20% |
| 63. | 15:30 | 2,741 | 1.17% |
| 64. | 15:45 | 2,683 | 1.15% |
| 65. | 16:00 | 2,525 | 1.08% |
| 66. | 16:15 | 2,558 | 1.09% |
| 67. | 16:30 | 2,976 | 1.27% |
| 68. | 16:45 | 2,403 | 1.03% |
| 69. | 17:00 | 2,532 | 1.08% |
| 70. | 17:15 | 3,565 | 1.52% |
| 71. | 17:30 | 2,264 | 0.97% |
| 72. | 17:45 | 2,425 | 1.04% |
| 73. | 18:00 | 2,421 | 1.04% |
| 74. | 18:15 | 2,447 | 1.05% |
| 75. | 18:30 | 2,488 | 1.06% |
| 76. | 18:45 | 2,518 | 1.08% |
| 77. | 19:00 | 2,668 | 1.14% |
| 78. | 19:15 | 2,676 | 1.15% |
| 79. | 19:30 | 2,892 | 1.24% |
| 80. | 19:45 | 3,035 | 1.30% |
| 81. | 20:00 | 3,225 | 1.38% |
| 82. | 20:15 | 2,789 | 1.19% |
| 83. | 20:30 | 2,842 | 1.22% |
| 84. | 20:45 | 2,934 | 1.25% |
| 85. | 21:00 | 2,623 | 1.12% |
| 86. | 21:15 | 2,543 | 1.09% |
| 87. | 21:30 | 2,360 | 1.01% |
| 88. | 21:45 | 2,686 | 1.15% |
| 89. | 22:00 | 2,575 | 1.10% |
| 90. | 22:15 | 2,744 | 1.17% |
| 91. | 22:30 | 2,375 | 1.02% |
| 92. | 22:45 | 2,654 | 1.14% |
| 93. | 23:00 | 2,878 | 1.23% |
| 94. | 23:15 | 2,312 | 0.99% |
| 95. | 23:30 | 2,506 | 1.07% |
| 96. | 23:45 | 1,975 | 0.84% |
This report was generated on May 28, 2026 00:15.
Report time frame June 3, 2024 00:10 to May 27, 2026 23:52.
| Web statistics report produced by: | |
 Analog 6.0 Analog 6.0 |  Report Magic 2.21 Report Magic 2.21 |